Market Recap
U.S. equity markets finished the fourth quarter on solid footing, with the S&P 500 rising 2.7% and ending the year up 17.9%. Gains continued to be driven by strong corporate earnings, particularly within technology and communication services, as enthusiasm around artificial intelligence, cloud investment, and productivity gains supported large-cap, growth-oriented companies. Performance, however, remained concentrated, with a relatively small group of mega-cap stocks accounting for a disproportionate share of returns. The Nasdaq also gained 2.7% in the quarter and finished the year up 21.1%. Large-cap growth stocks outpaced value (18.6% vs. 15.9% for the year), while small caps posted more modest gains, ending 2025 up 12.8%.
International equities meaningfully outperformed U.S. markets for the first time in several years. Developed markets gained 4.9% in the quarter and delivered a strong 31.2% return for the year, while emerging markets rose 4.7% in the quarter and 33.6% for the year. A weaker U.S. dollar, down 9.4% in 2025, provided a notable tailwind for foreign assets.
In fixed income markets, the Federal Reserve cut rates by 25 basis points in December, bringing the policy rate to 3.5%–3.75%. Bond returns were positive, with core bonds up 1.1% in the quarter and finishing the year with their best performance since 2020.
Investment Outlook and Portfolio Positioning
At the start of 2025, investor expectations were relatively modest, with many forecasters projecting U.S. equity returns roughly in line with earnings growth of about 8%. As the year unfolded, markets significantly exceeded those expectations, more than doubling initial forecasts. While market predictions are often wide of the mark, each year-end brings a new round of outlooks. As 2026 approaches, consensus equity return estimates once again cluster around 8%, though forecasts span a wide range. Then again, most of these estimates fail to come close to what occurs.
Equity valuations remain elevated to start the new year. The S&P 500 is trading near 23x forward earnings, well above its long-term average of roughly 15.6x. This reflects investors’ willingness to pay a premium for expected growth, supported by optimism around economic resilience and another year of solid earnings. Elevated valuations do not imply an imminent market downturn, but they do tend to constrain longer-term returns. Historically, periods with similar starting valuations have been followed by lower subsequent real returns over the next decade, though the historical sample is limited. In the shorter term, high valuations may increase market sensitivity to earnings disappointments or shifts in investor sentiment.
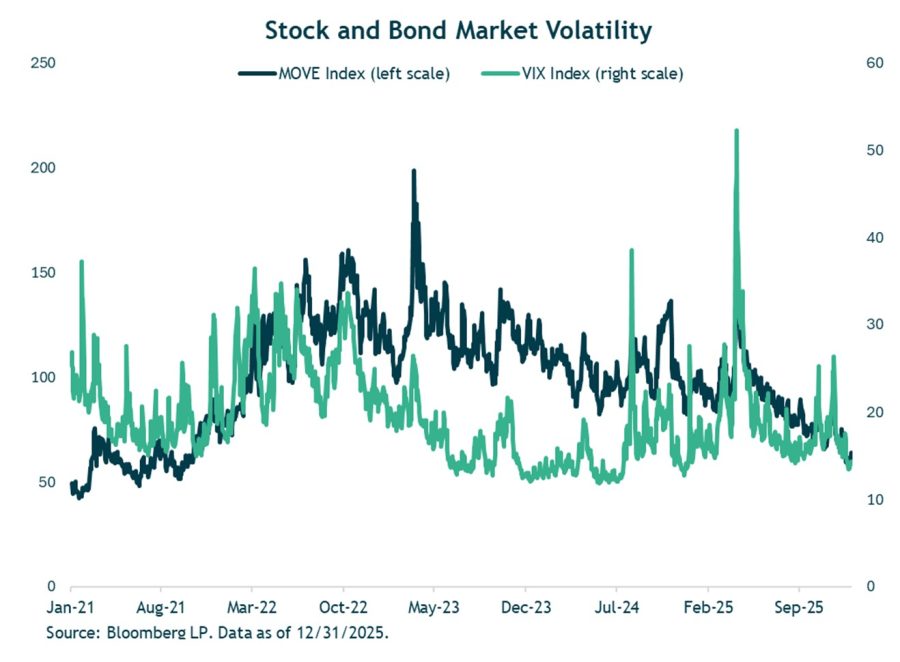
Investor confidence has improved since April’s tariff ordeal, which is illustrated in the chart below by meaningfully lower market volatility in both the stock and bond markets. Volatility, a market measure of “fear,” is tracked via the VIX Index for stocks and the MOVE Index for Treasury bonds, both of which reflect the implied volatility embedded in options prices. Options become more valuable when uncertainty is high, as volatility tends to rise during periods of market stress and fall during calmer conditions. As shown in the chart below, both equity and bond volatility peaked in April following President Trump’s tariff announcement and have since trended lower, returning to levels historically associated with more stable and optimistic markets. The lower levels reflect less anxiety around factors such as trade policy and its economic impact, and Fed policy, all of which have supported investor confidence and business decisions. There are always trade-offs and while low volatility markets can be good for markets, finding attractive valuations in calmer markets can be tough, leaving markets more susceptible to negative news.
Looking ahead, current valuation levels suggest returns will be driven more by earnings durability and cash-flow generation than by further multiple expansion. Notably, much of today’s technology-led earnings growth is underpinned by tangible, long-term capital investment rather than financial leverage, differentiating this cycle from prior valuation peaks. Elevated spending across artificial intelligence, energy, and infrastructure reflects responses to demographic pressures and labor scarcity. While cyclical risks remain, these multi-year investment trends may help support growth and reduce the likelihood of a traditional recession. In this environment, elevated valuations reinforce the importance of selectivity, diversification, and a focus on companies with durable earnings power and strong balance sheets.
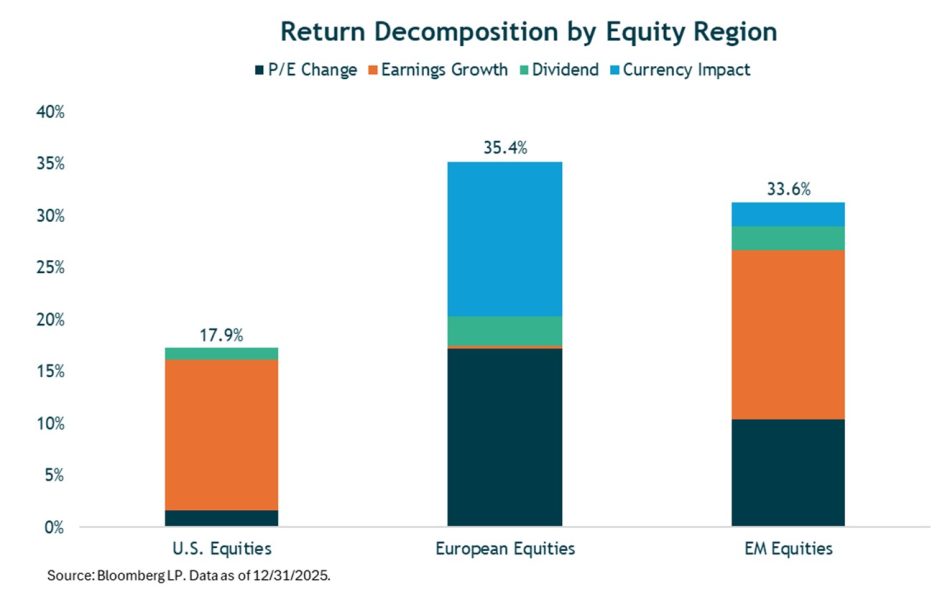
In 2017—President Trump’s first full year during his first term—international equities outperformed U.S. equities. And much like in 2017, this year saw international equities outpace U.S. equities. European equities gained 35.4% and emerging-markets equities jumped 33.6% in U.S. dollar terms in 2025. The lion’s share of this outperformance relative to U.S. stocks occurred during the first quarter, aided by a significant depreciation of the U.S. Dollar relative to its international counterparts.
As I’ve highlighted in past commentaries, the U.S. dollar is a key factor in foreign equity outperformance. The ICE U.S. Dollar index fell nearly 10% in 2025—providing a nice kicker on top of already strong foreign equity returns. The strength of the Euro and British pound relative to the U.S. dollar was the culprit behind the dollar’s depreciation. MSCI Europe returned 20.6% in local currency terms—a figure modestly better than U.S. large caps—however, the decline of the dollar boosted MSCI Europe’s return to 35.4% in dollar terms. In addition to the dollar’s fall, European equity returns were driven by expanding price/earnings multiples. European earnings (in local currency terms) were essentially flat in 2025—meaning valuation expansion and the dollar were the key drivers behind the strong performance. In contrast, emerging-market equity returns were more fundamentally driven. Valuations moved higher in emerging markets; however, earnings growth drove most of the 33% return.
The Fed and monetary policy remain a key focus. The Federal Reserve cut rates three times during the year, and the FOMC’s current expectation is for one more cut in 2026. Given the strength of year-end economic data, I don’t believe we will see rapid or aggressive rate cutting in 2026, at least not in the early part of the year. Market participants are currently pricing in two and a quarter rate cuts next year, which would bring the Fed funds rate to approximately 3%. The FOMC’s single-cut expectations reflect caution about above-target (2%) inflation while acknowledging a softening job market. A modest rate-cutting environment can be supportive for both stocks and bonds, but a return to the 0% interest rates that fueled strong stock price appreciation earlier in the decade is unlikely.
With Fed Chair Jerome Powell’s term coming to an end in May 2026, there is growing concern that the Federal Reserve will become more politicized. Some investors worry that political influence at the Fed, specifically pressure to meaningfully lower short-term interest rates, will lead to higher inflation, higher long-term interest rates, and more volatility in the bond market.
As for current bond yields, higher yields have improved the income potential of bonds compared to recent years. 10-year Treasury yields finished the year in the low-4% range (4.18%), offering decent levels of income while also providing diversification benefits within portfolios. Investment-grade corporate bonds continue to reflect strong credit quality, but credit spreads are relatively tight, limiting price appreciation in corporate credit. High-yield bonds also have compressed spreads, signaling investor confidence in the economic outlook and corporate balance sheets, but leaving less room for error should growth slow meaningfully or defaults rise, neither of which I see happening in the immediate-term. But high valuations in the bond market, like the equity market, argue for selectivity.
My base case is that the yield curve will steepen in 2026. I think most of the steepening will come from the front-end moving lower. As of year-end, the Fed Funds rate range is 3.5%-3.75%. I think there will be more than one rate cut by the end of 2026, which seems consistent with slowing but decent growth, some weakening in the labor market, and inflation slightly above target but easing lower. In contrast, I think longer-term yields are likely to stay relatively stable, with some volatility.
Closing Thoughts
Looking ahead to 2026, my outlook remains constructive, with real GDP growth expected to range between 2.0% and 3.0%, supported by consumer spending and an ongoing investment cycle tied to infrastructure, energy, and productivity-enhancing technologies. While AI-related investment has been a major contributor to recent growth, I expect its pace to slow from the exceptionally fast levels seen over the past two years. Importantly, the macro backdrop appears neither strong enough to force monetary tightening nor weak enough to meaningfully undermine corporate earnings.
This cycle has challenged many traditional economic and market frameworks. Signals that have historically predicted recessions such as an inverted yield curve, weak leading economic indicators, and rising unemployment have so far failed to produce the expected recession. While these indicators should not be ignored, relying on them in isolation may prove less useless in an environment shaped by demographic constraints, constrained labor supply, and sustained capital investment. In such a regime, flexibility, diversification, and a focus on underlying fundamentals remain more valuable than adhering to historical rules of thumb.
Thank you for your continued trust and partnership. Wishing you a healthy and prosperous 2026.
Jeff (1/12/2026)
Certain material in this work is proprietary to and copyrighted by iM Global Partner Fund Management, LLC and is used by Bogue Asset Management LLC with permission. Reproduction or distribution of this material is prohibited and all rights are reserved.